
End-to-End CI/CD for AWS Aurora MySQL using Jenkins + Terraform + Flyway + Monitoring
Architecture
This architecture shows how to automate AWS Aurora MySQL deployment using Jenkins + Terraform, while keeping database changes controlled through Flyway and observability through Prometheus/Grafana.
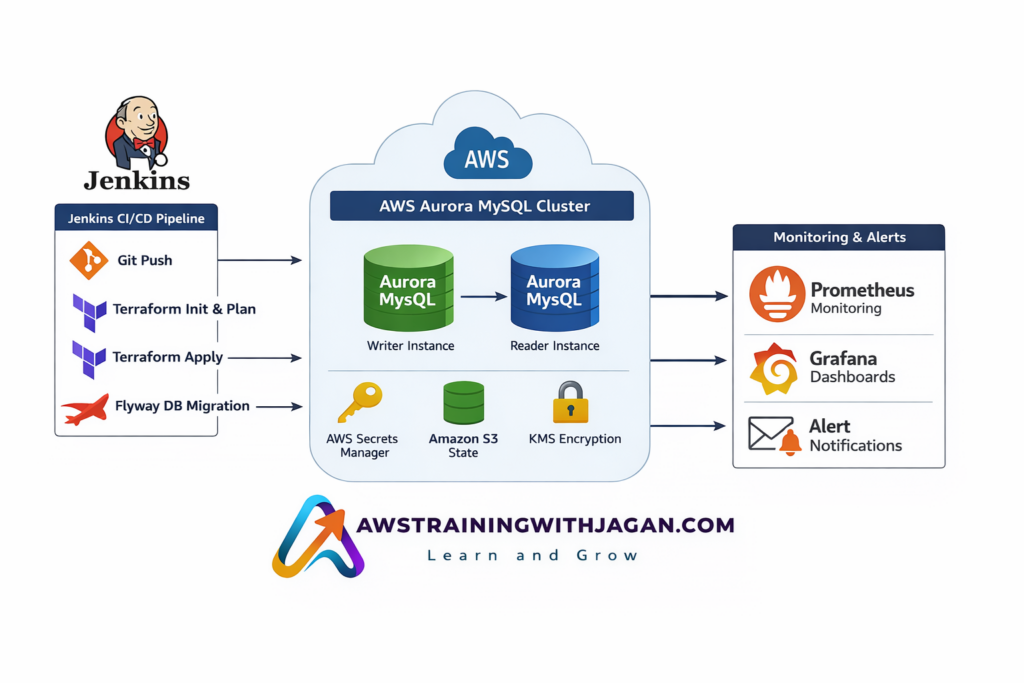
Step-by-step architecture flow
1. Git Push triggers Jenkins
The process starts when Terraform code, pipeline code, or migration scripts are pushed to Git. Jenkins detects the change and starts the CI/CD pipeline.
2. Jenkins runs Terraform Init & Plan
Jenkins initializes the Terraform working directory, downloads the AWS provider and modules, and generates an execution plan. This helps validate what infrastructure changes will happen before deployment.
3. Jenkins runs Terraform Apply
After validation and approval, Jenkins executes terraform apply to provision or update AWS resources. This includes:
- Aurora MySQL cluster
- Writer instance
- Reader instance
- Security groups
- DB subnet group
- KMS encryption
- Secrets Manager
- S3 backend state storage
4. Aurora MySQL cluster is created in AWS
The core database layer is deployed as an Aurora MySQL cluster.
- The Writer Instance handles read/write operations
- The Reader Instance handles read-only traffic for scaling and performance
This gives better availability, failover support, and read scalability.
5. Secrets are managed securely
Database usernames and passwords should not be hardcoded. They are stored in AWS Secrets Manager, so applications and migration tools can access credentials securely.
6. Terraform state is stored in Amazon S3
Terraform keeps its state in Amazon S3, which makes infrastructure changes traceable and consistent across team members and Jenkins runs.
7. KMS provides encryption
AWS KMS is used for encryption of the Aurora cluster and other sensitive resources. This improves compliance and production security posture.
8. Flyway handles DB schema migration
Terraform creates the infrastructure, but Flyway applies the actual database schema changes such as:
- tables
- indexes
- constraints
- stored procedures
- versioned SQL scripts
This is the correct DevOps practice because infrastructure and schema versioning should be separated.
9. Prometheus monitors the platform
Metrics from the database and related infrastructure are collected through Prometheus. This helps teams monitor health, usage, and performance.
10. Grafana provides dashboards
Prometheus data is visualized in Grafana dashboards, giving a clear view of CPU, memory, connections, storage, latency, and availability trends.
11. Alerts notify the operations team
Alerting can be configured for thresholds such as:
- high CPU
- low free memory
- high DB connections
- replica lag
- storage issues
- failed migrations
This supports proactive database operations.
A strong DevOps database pipeline is not just about creating a DB manually.
It is about automating the full lifecycle:
Git → Jenkins → Terraform → Aurora MySQL → Flyway → Prometheus/Grafana
With this approach, teams get:
- repeatable infrastructure provisioning
- secure credential handling
- controlled schema migrations
- monitoring and alerting
- production-ready automation
This is the kind of architecture that helps teams move from manual DBA tasks to real cloud automation.